In 2019, I got into making statistics out of how my art, especially writing projects, progresses and make infographs about them with HTML and CSS. I eventually ended up making statistics about my Flash Fiction Month and Prose-ject 2019 participations as well. In addition to these, I made a widget for showing the status of each of my ongoing project, which I have since then added on this website.
Samples of the infographs. Please click for full view.
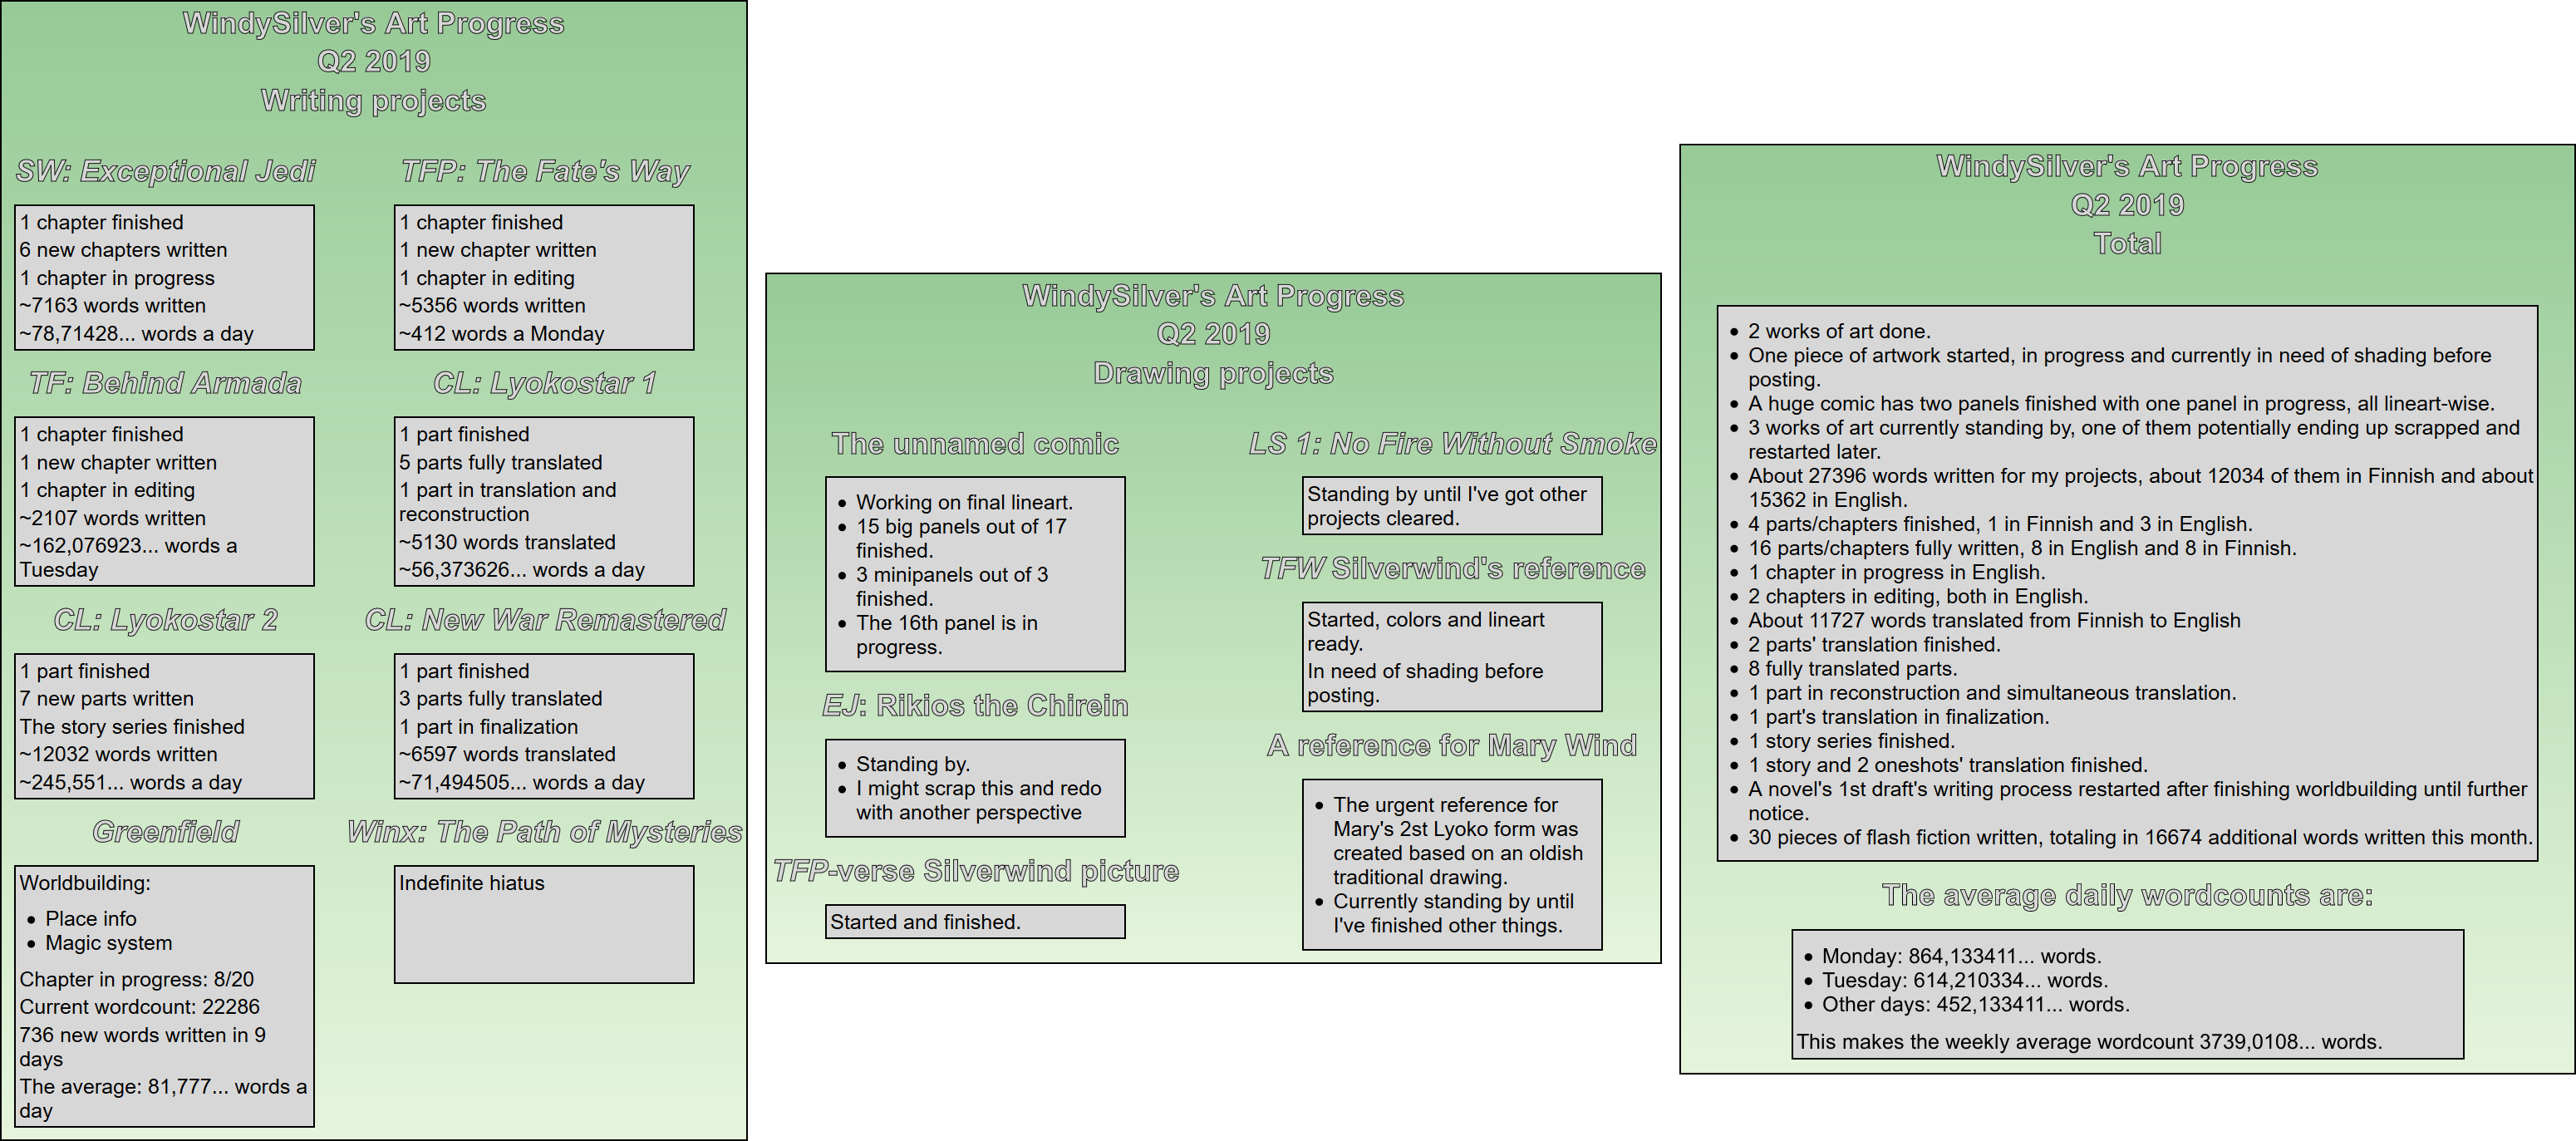
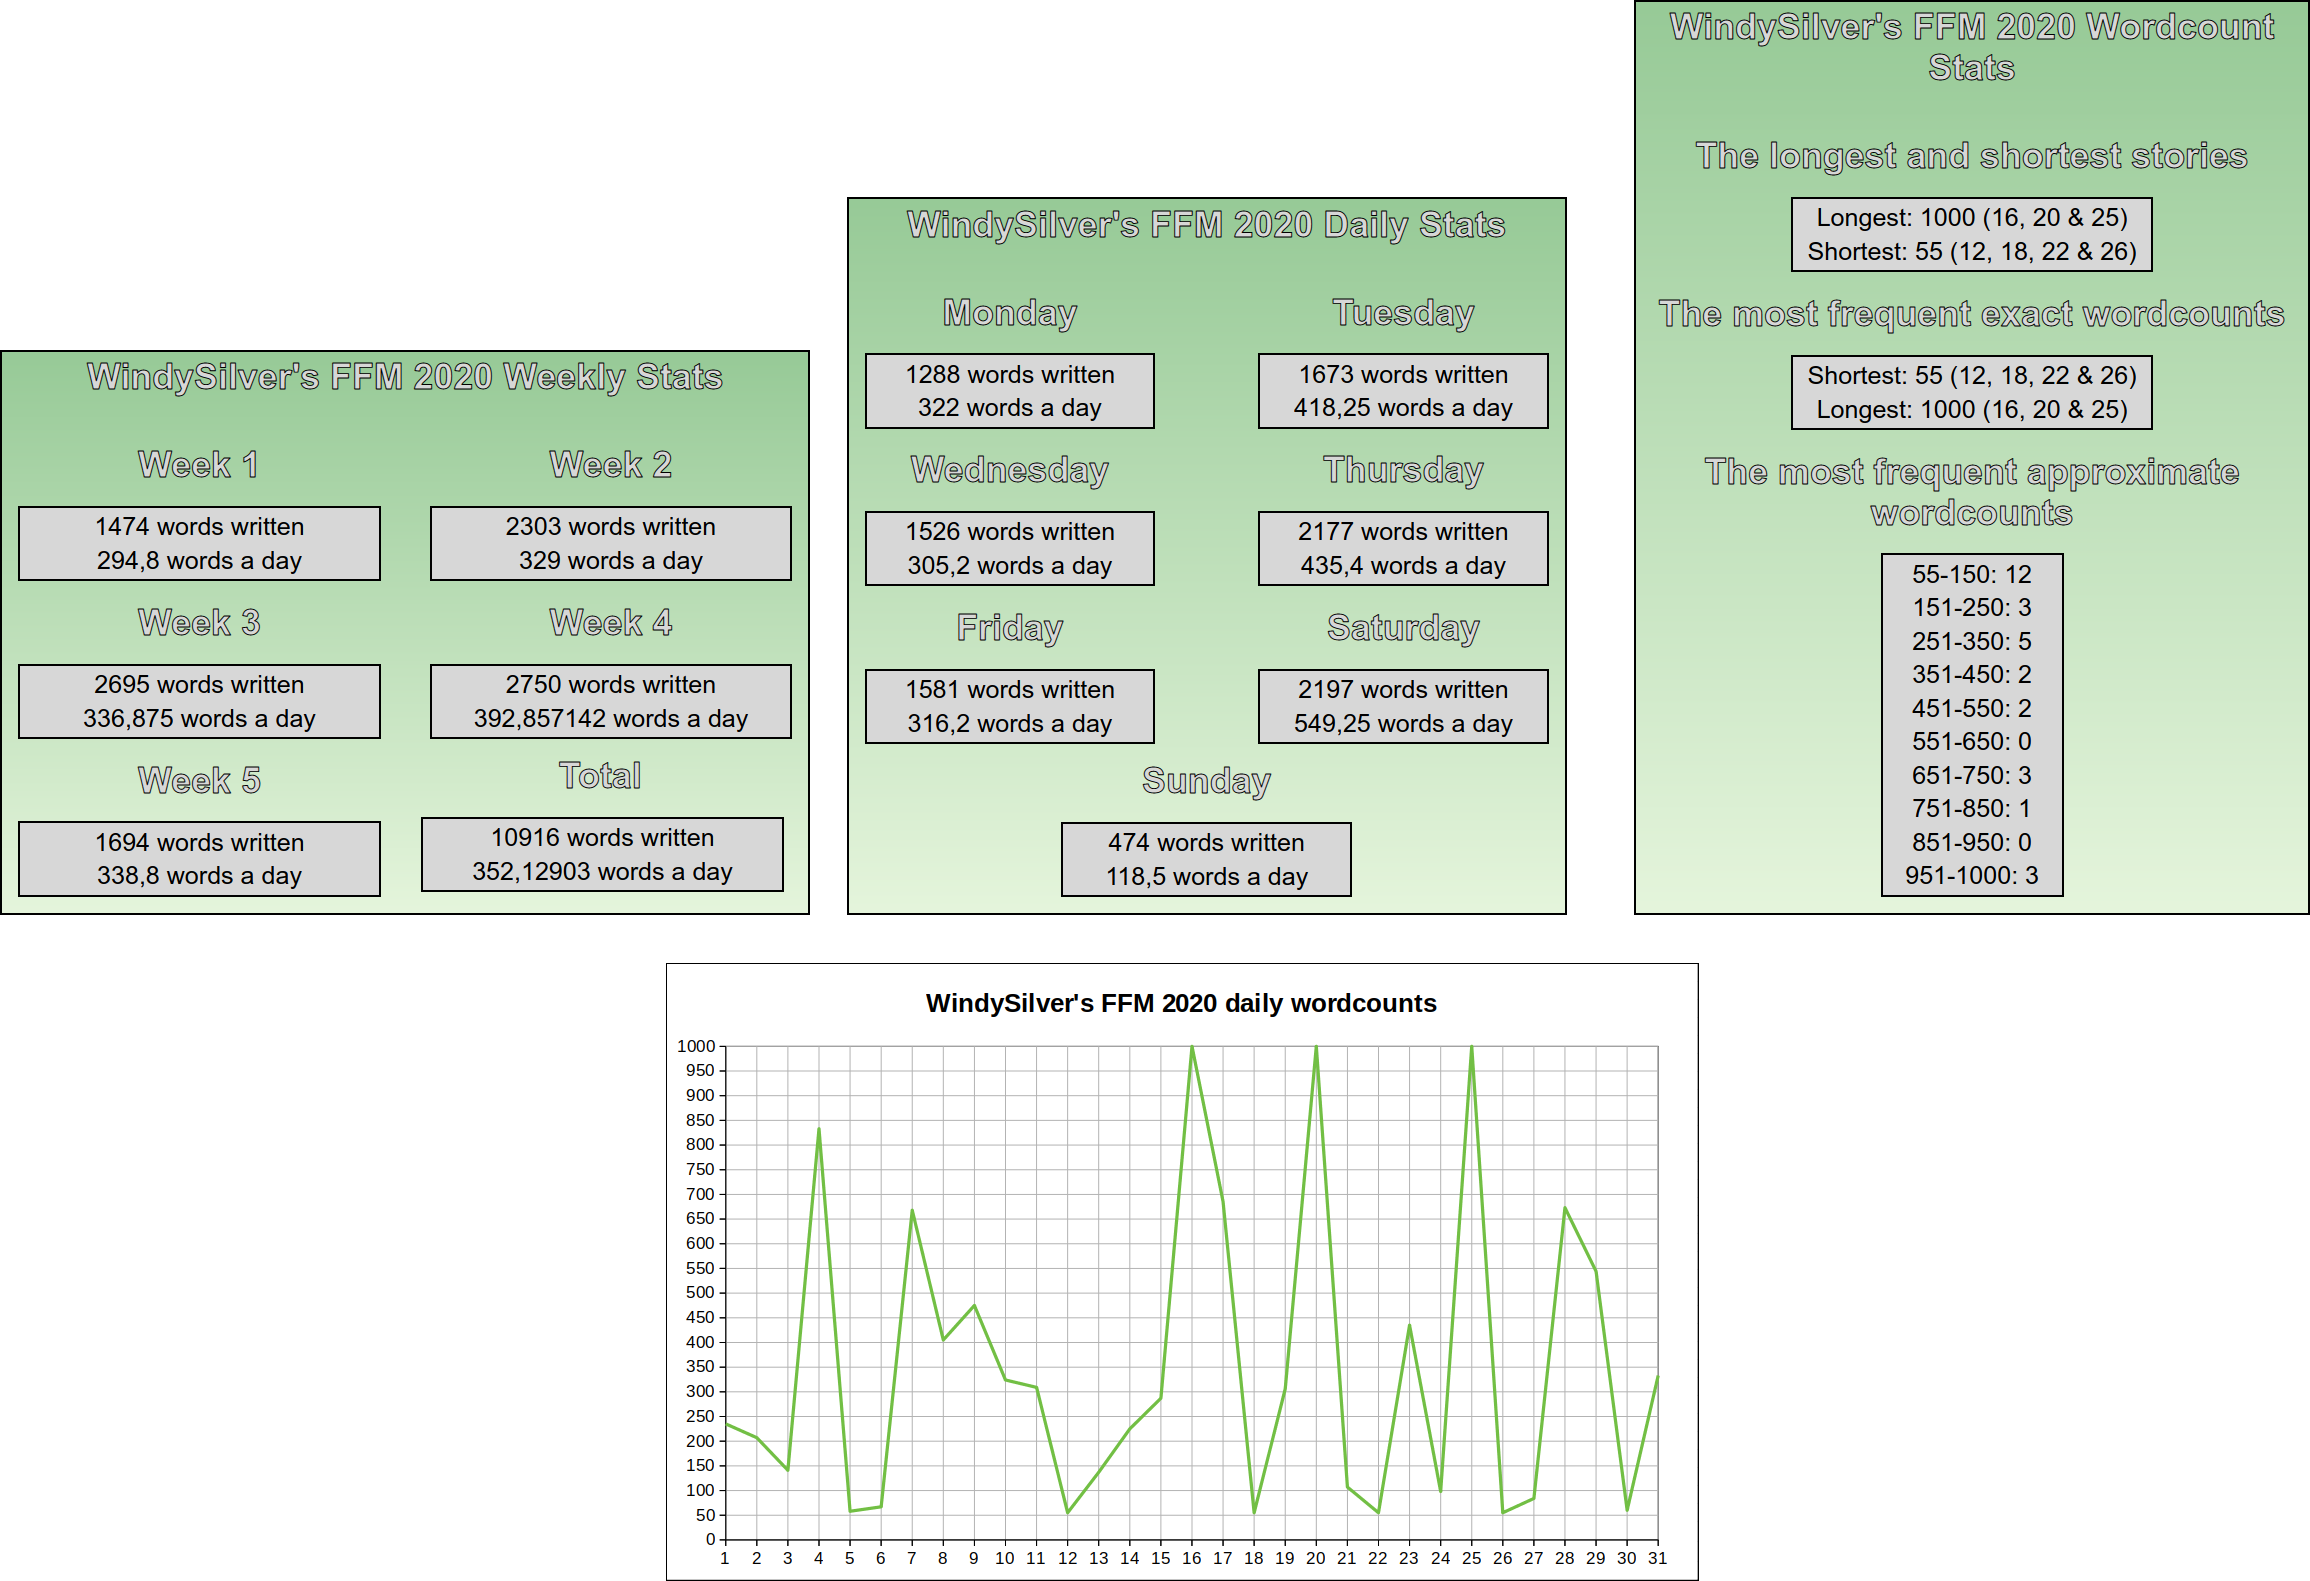
Q2 2019 infographComparison between Q3 and Q4 2019Prose-ject 2019 statistics and a graph made on Microsoft Excel which was added while compiling the picture for postingFlash Fiction Month 2020 statistics and graph made on LibreOffice Calc which was added while compiling the picture for postingMy current projects widget 15/5/2020
Published by WindySilver
N. WS. Jokela, more commonly known as WindySilver, is a Finnish programmer and a hobbyist artist fighting a war against procrastination on the losing side. When her free time is not taken up by things like reading, procrastination, video games, watching series or more procrastination, she mainly writes sci-fi fanfiction and original flash fiction of various genres. While she dabbles in a lot of things ranging from digital art to jewelry to plants to whatever catches her interest, writing is her persistent forte.
You should not give her yet another crazy flash fiction challenge to take part in because she simply cannot say "no" to it.
View all posts by WindySilver